https://www.nigeriaforextrading.com/...ut-system.htmlOriginally Posted by ;


https://www.nigeriaforextrading.com/...ut-system.html

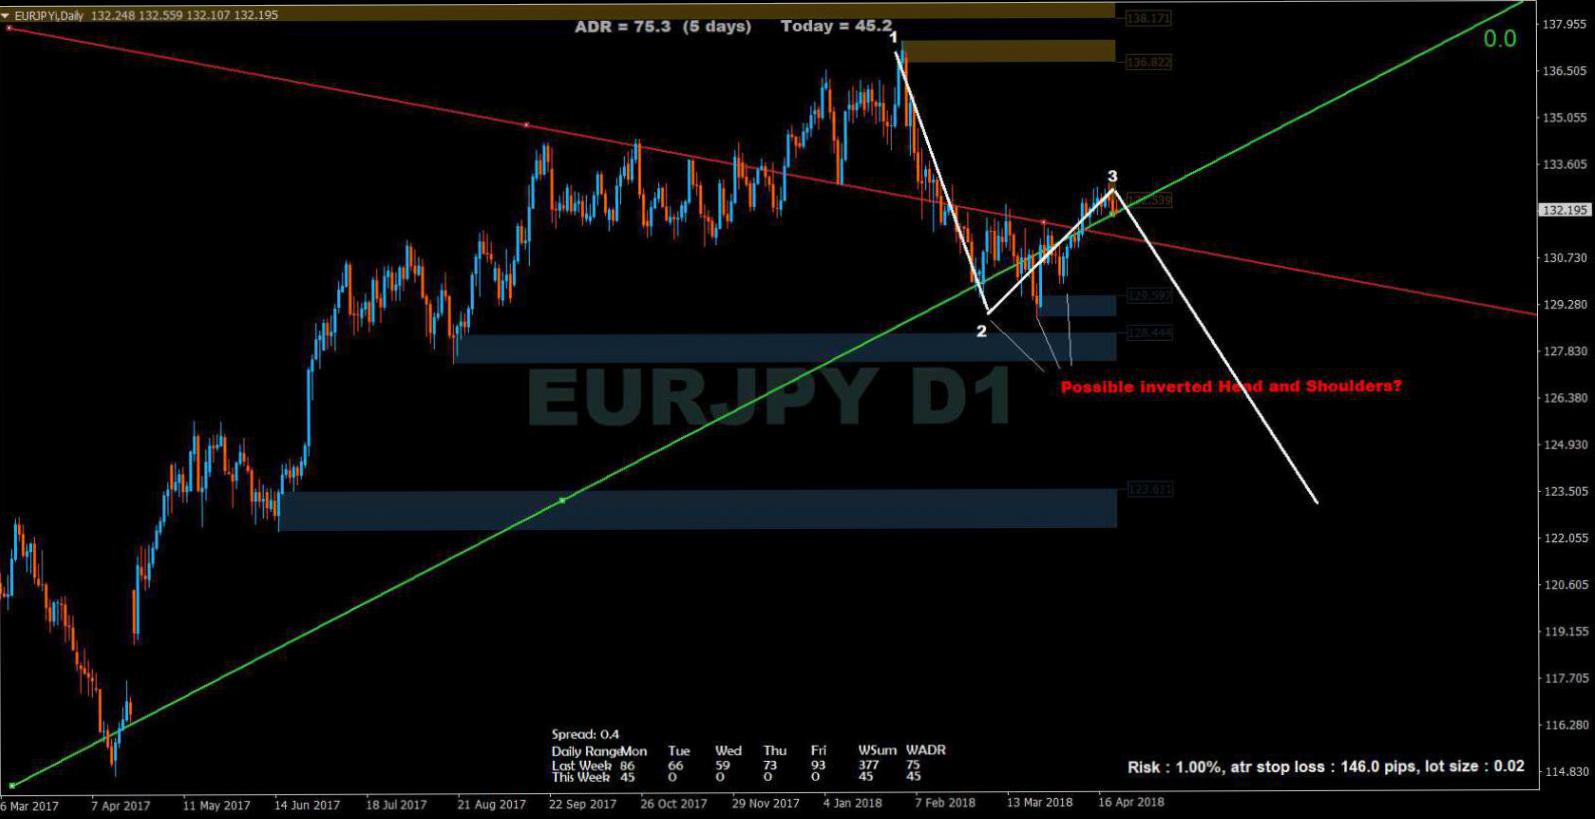
First chart makes sence for me. Uptrend TL is set after which price made new HH.
If I was in Buy trade I'd close at a half place after daily bar moved entirely below this line.
On the next chart I would not place major uptrend TL like you did because there is no new HH.
A number of recent bars may be believed to be a pullback for downtrend, therefore second chart is rather good to help with new trade decision within next few days.
Only my thougts

You are totally perfect. Thank you
Here is the right one. Sorry but I m posting from telephone

I don't think, it is something similar to a 45 degree angle
Anyhow, your trendline must act as a dynamic support in an uptrend... not resistance

Seeing it a little different. But we'll see.

I' am in EUR/JPY, Searching for add positions
Discount TP and SL pls
Edit: Closed. I see a lot of indecision and no momentum within this moment.


Possible inverted Head and Shoulders?

I Might be wrong but I see a Possible Harmonic Pattern

My understanding is that TL shouldn't be too steep when it is just placed to allow price to move from the direction of the trend, not generate exit sign too early by little pullback.
Afterwards while trend is progressing you move right side of TL based on major pullbacks, therefore TL becomes increasingly more steep ordinarily.
Attached chart shows already well established uptrend and TL doesn't look steep.
Always trust yourself and do not be greedy.

 Posting Permissions

 Reply With Quote